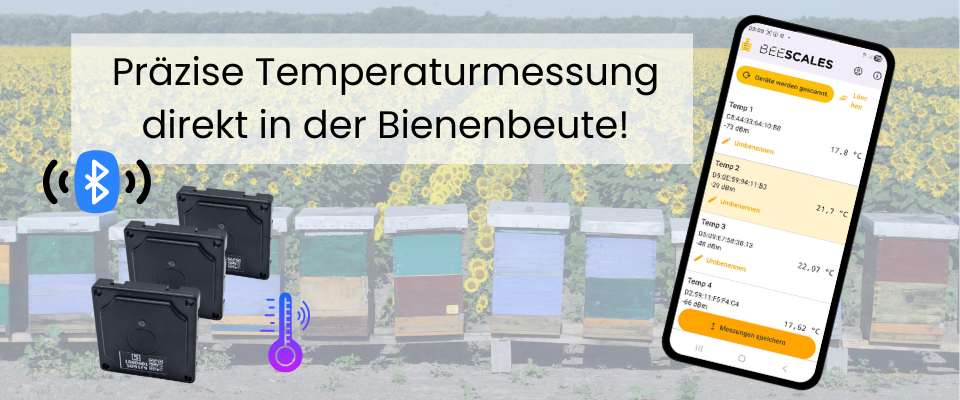
Why measure temperature inside the hive?
Temperature in the brood area is one of the most reliable live indicators of a colony’s condition. Honey bees regulate it very precisely — typical temperature patterns correspond directly to events inside the hive. Thanks to low-cost sensors, you can equip all colonies at an apiary and keep the whole site under observation.
Early detection of brood start
When the queen begins laying in spring, the brood temperature stabilises at around 34–35 °C. You will see the start of brood rearing early and can plan expansions and your first inspections accordingly.
Recognise queen problems in time
If the temperature drops sharply after a stable phase or becomes erratic, this indicates queenlessness or a weak queen. You can intervene before the colony declines significantly.
Monitor swarming tendency
Before swarming many colonies show a characteristic temperature pattern: a slight rise and additional fluctuations. The sensor helps detect swarming tendency early, before the colony leaves.
Check overwintering without opening
In winter you can tell from the temperature whether the cluster is active, weakening, or whether a colony has died — all without opening the hive and disturbing the bees.
Fewer inspections, less stress
Every inspection cools the brood nest and costs the colony energy. With temperature data you can plan checks more precisely and reduce unnecessary openings — benefiting both the bees and your honey yield.
Overview of all colonies at the apiary
The sensors are priced so that you can equip all colonies at a site. This lets you see at a glance which colonies are strong, which are reacting unusually, and where a physical check is really required.
Android app for reading & upload
Measurements are read out with a mobile Android app. The app displays the temperature curves of all sensors at an apiary side by side. With one tap you can upload the data to the server for later analysis and long-term comparisons.
Gateway with SIM card (from spring 2026)
From spring 2026 a gateway with an integrated SIM card will be available. It will read the temperature data from all sensors at the apiary autonomously and send it automatically to the server — ideal for remote sites where you are not regularly on site or do not want to use a smartphone every time.
BeeScales.io Diagnostics — Bluetooth app for hive monitoring

BeeScales.io Diagnostics is a mobile app that connects to your BeeScales scales and Bluetooth temperature sensors at the apiary. It is designed for quick on-site checks and for sending measurements to your BeeScales account.
What the app can do
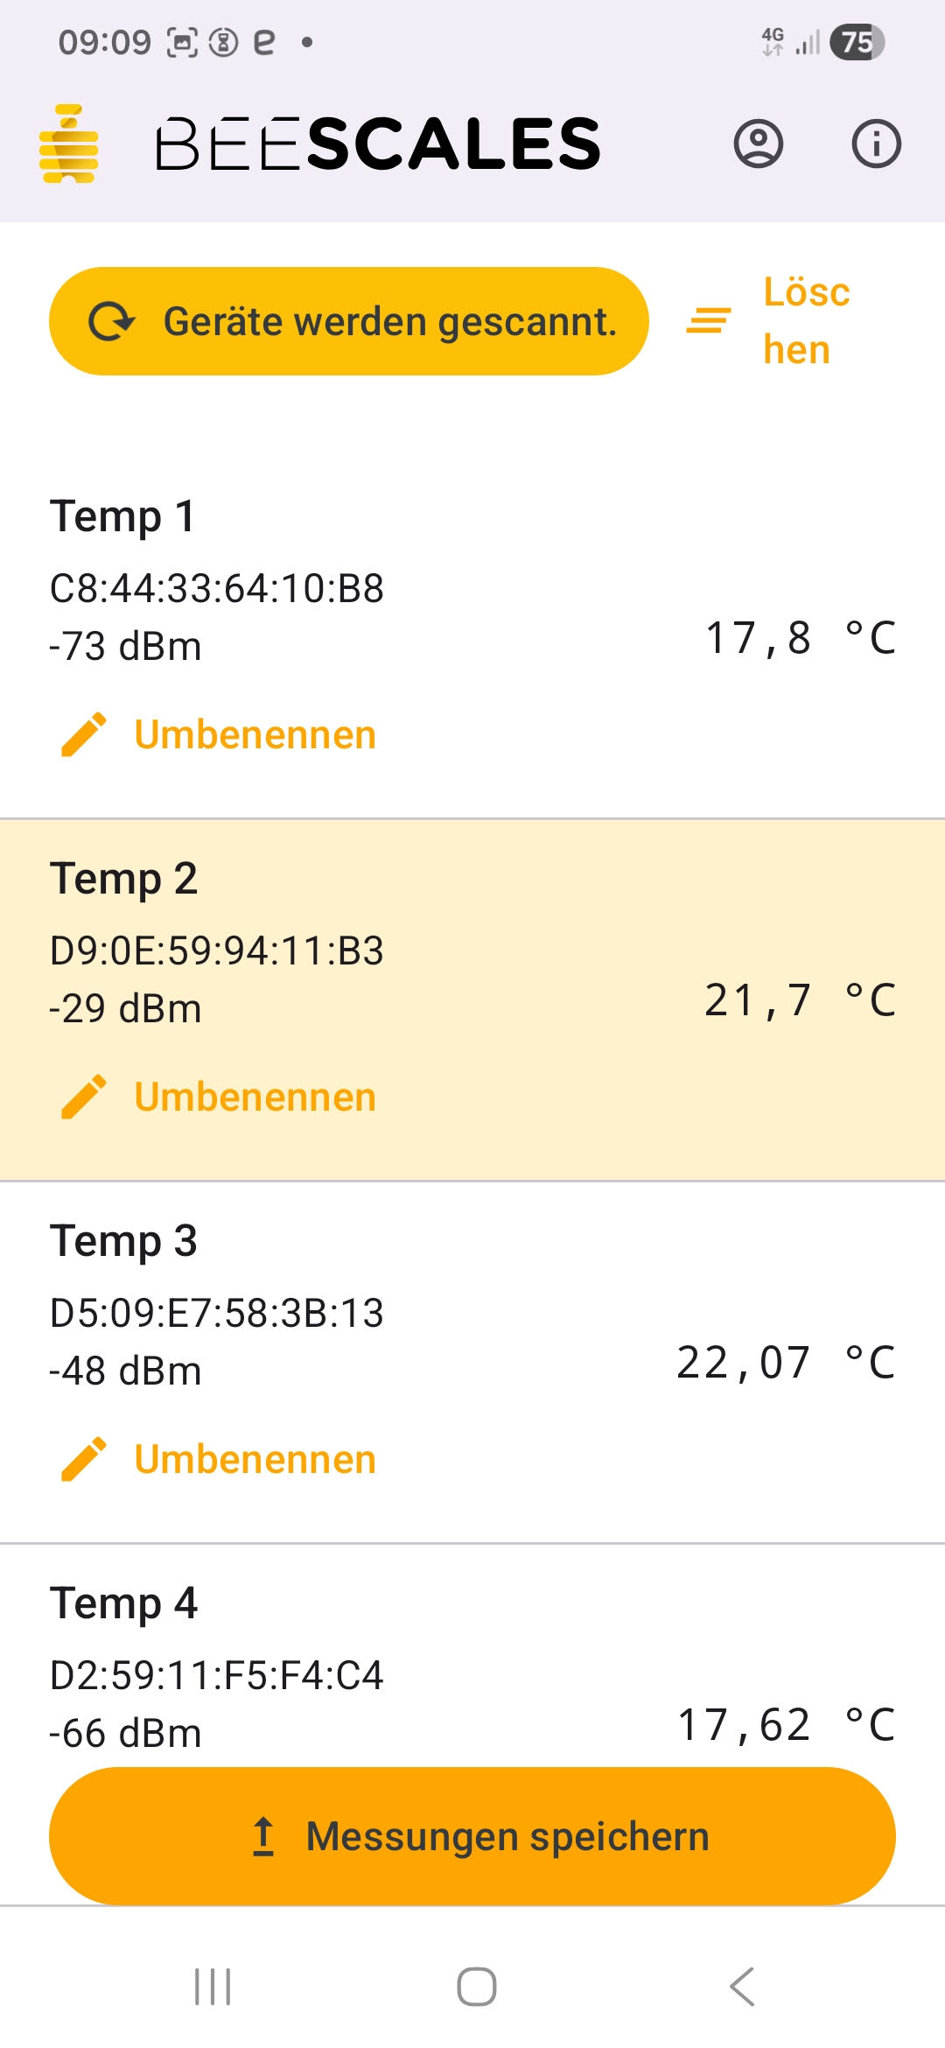
- All nearby sensors at a glance
The app scans for all compatible Bluetooth temperature sensors in range and lists them. You immediately see the current temperature for each colony at a site.
- Instant identification with the sensor button
Each temperature sensor has a button. When you press it, the corresponding sensor entry in the app is highlighted immediately. This makes it easy to identify which physical sensor belongs to which entry in the app.
- Custom names for each colony
Assign a unique name to each sensor (e.g. Colony 1 – Queen 2024, Nucleus 3). This makes it clear at all times which measurement belongs to which colony — even with many sensors.
- Monitor colony health in winter and spring
Sensors are placed in the hive, directly in or above the winter cluster. Stable and appropriate temperatures help assess colony strength, brood development and overwintering — all without opening the hive.
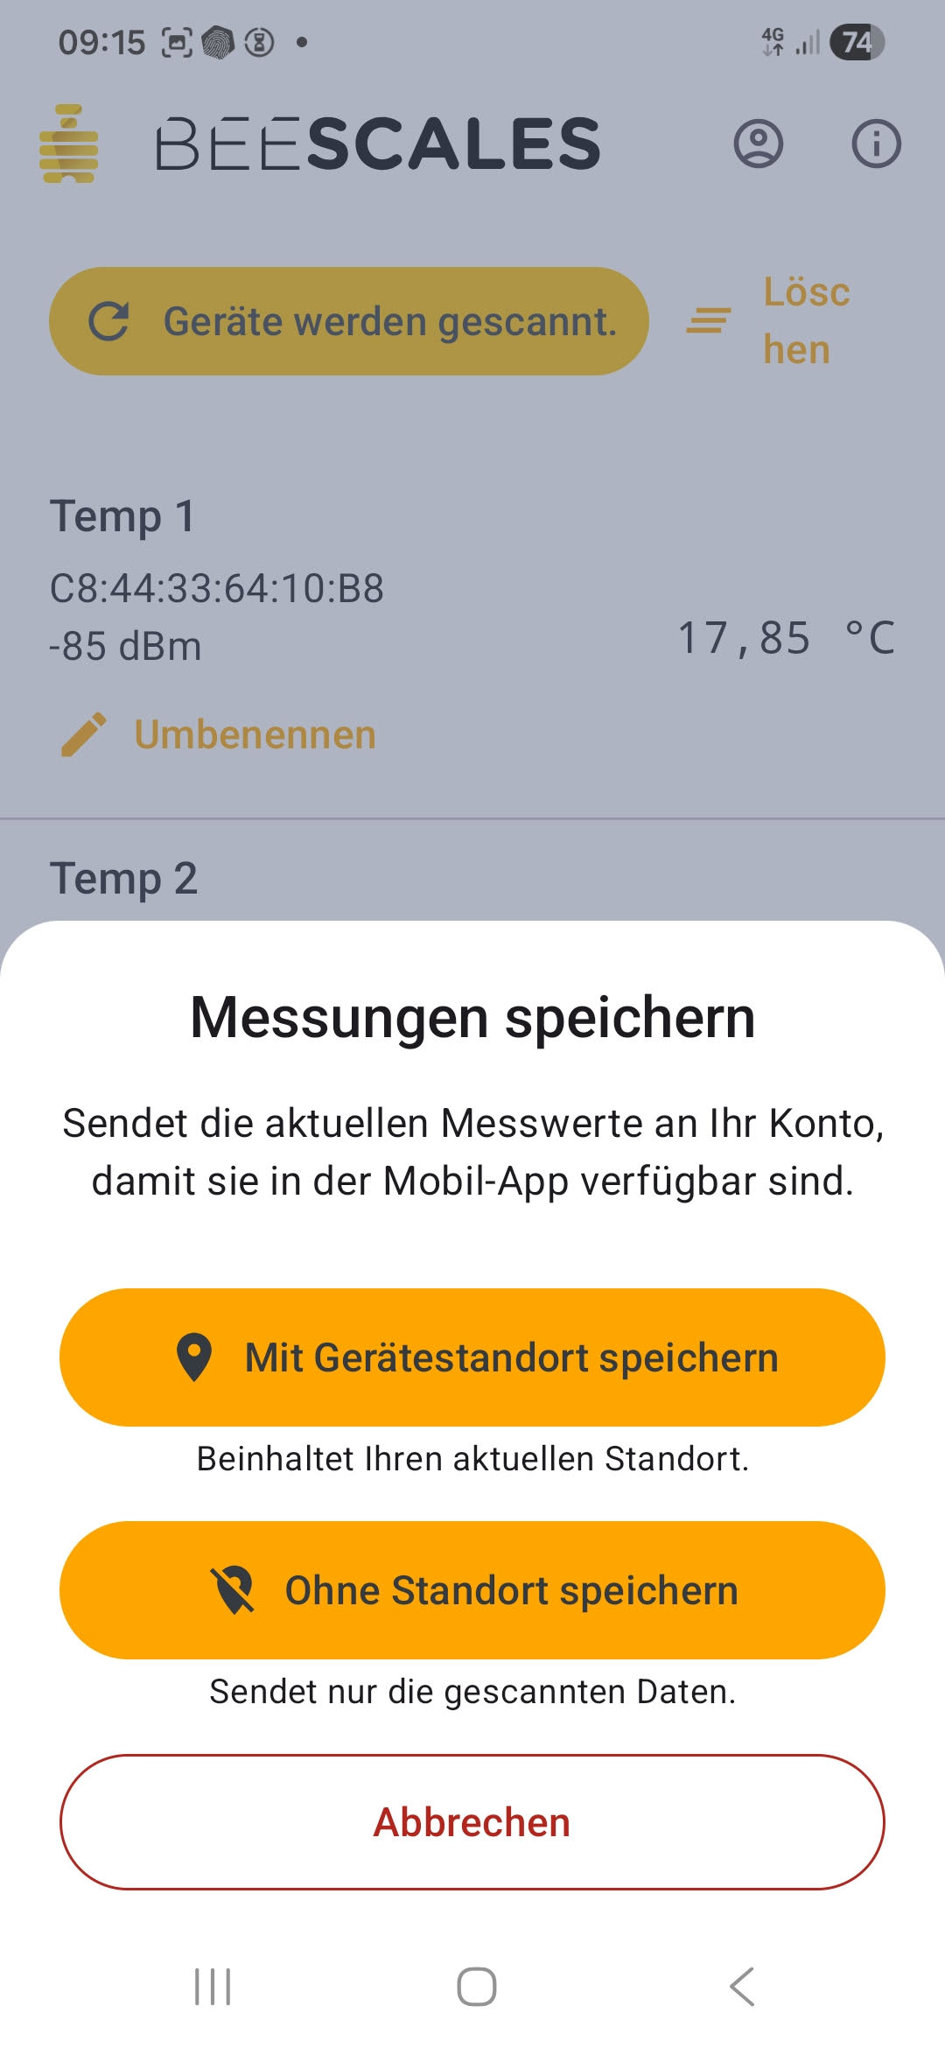
- Save measurements to your account
With one tap you can send the current measurements from all discovered sensors to your BeeScales account so they are available later in the mobile or web app.
You can choose whether to save:
- With device location — measurements + the smartphone’s current GPS position
- Without location — sensor data only
- Support for Bluetooth BeeScales
The same app also connects to BeeScales Bluetooth scales (e.g. the Compact scale with e‑paper display) and can upload weight data together with temperature measurements.
- Easy operation in the field
Large buttons, clear fonts and coloured highlights make the app easy to use even with gloves and in sunlight.
Typical temperature patterns — what do the curves show?
The following examples show common patterns you’ll encounter in practice. The charts are language‑neutral and can be explained in any language.
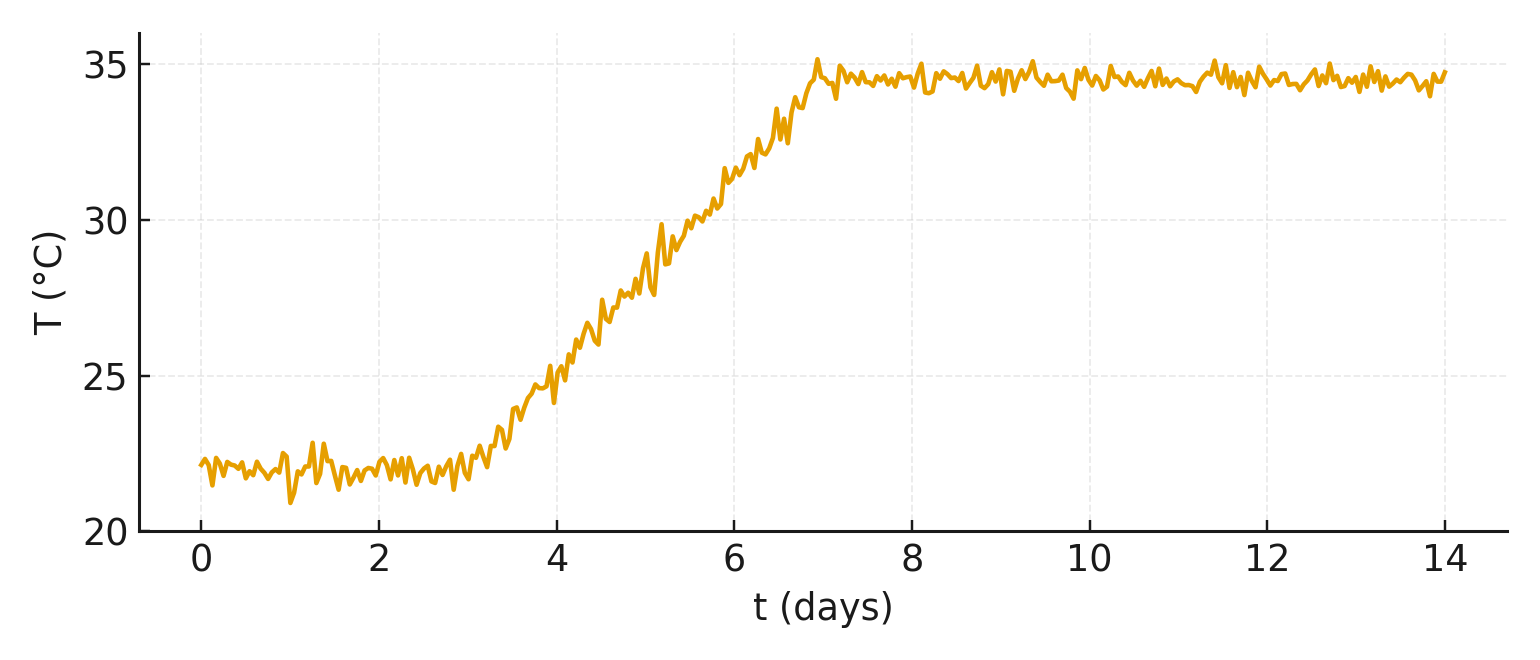 Example 1: Start of brood in spring
The temperature rises out of the winter/transition range and stabilises in the brood area (approx. 34–35 °C). The colony is developing and the queen is actively laying.
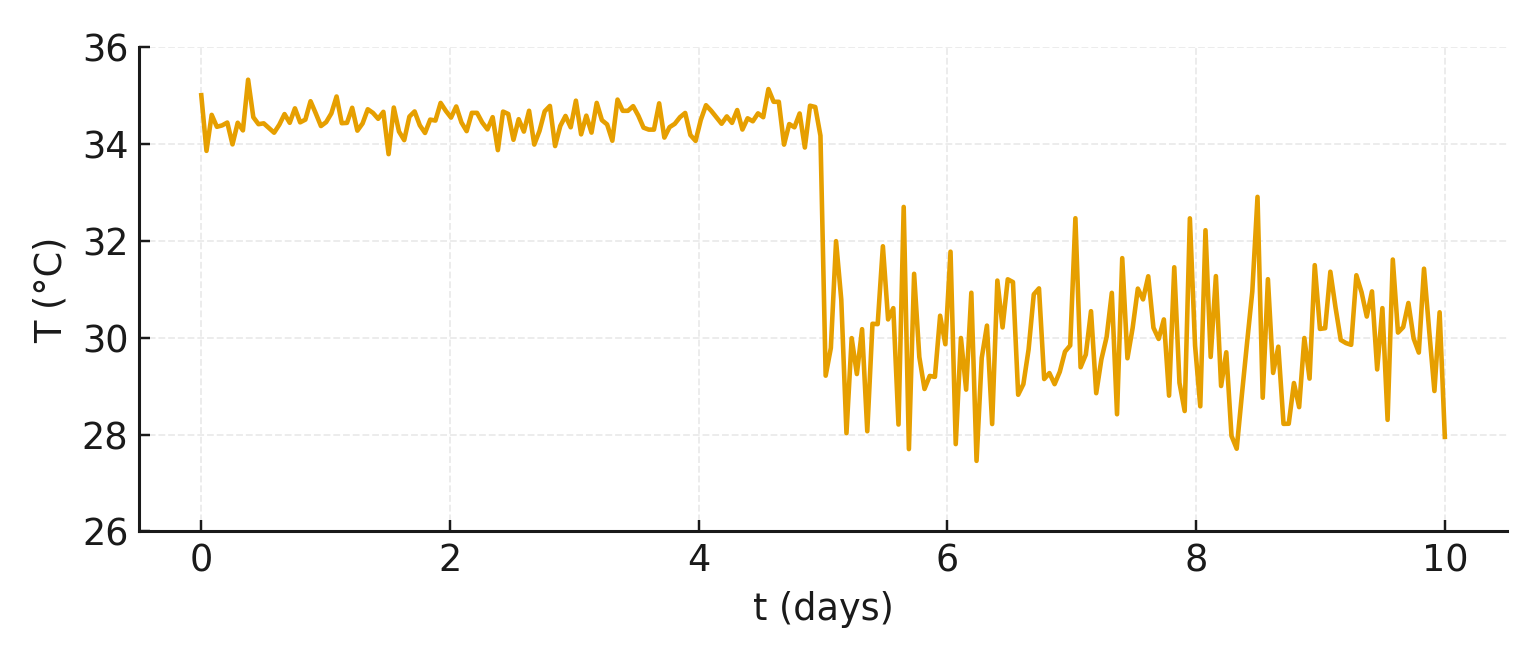 Example 2: Queen problem / queenlessness
After a phase of stable brood temperature the curve drops noticeably and becomes erratic. Possible cause: lost queen or interrupted brood. A physical inspection is strongly recommended.
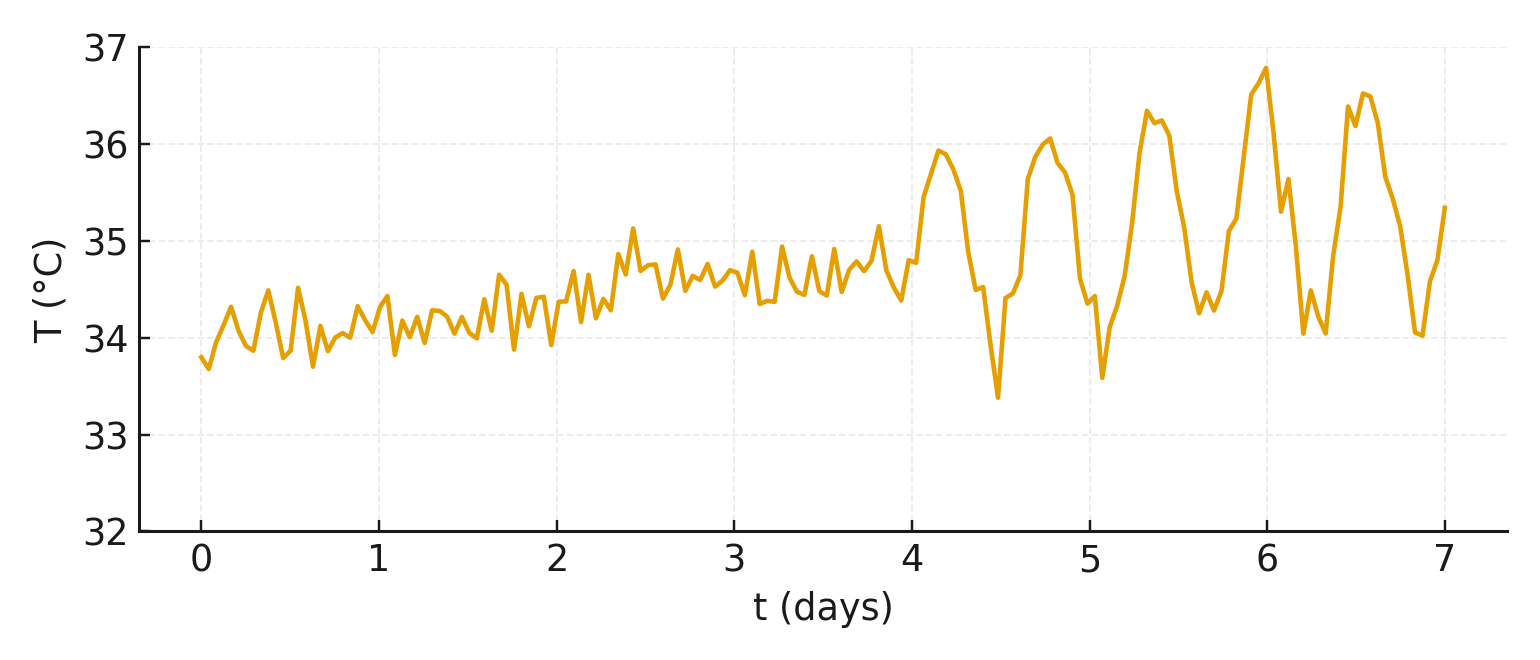 Example 3: Swarming tendency
Slight temperature increase and characteristic wave patterns over 1–3 days. The colony is very active and may be preparing to swarm. Check for queen cells and take appropriate measures.
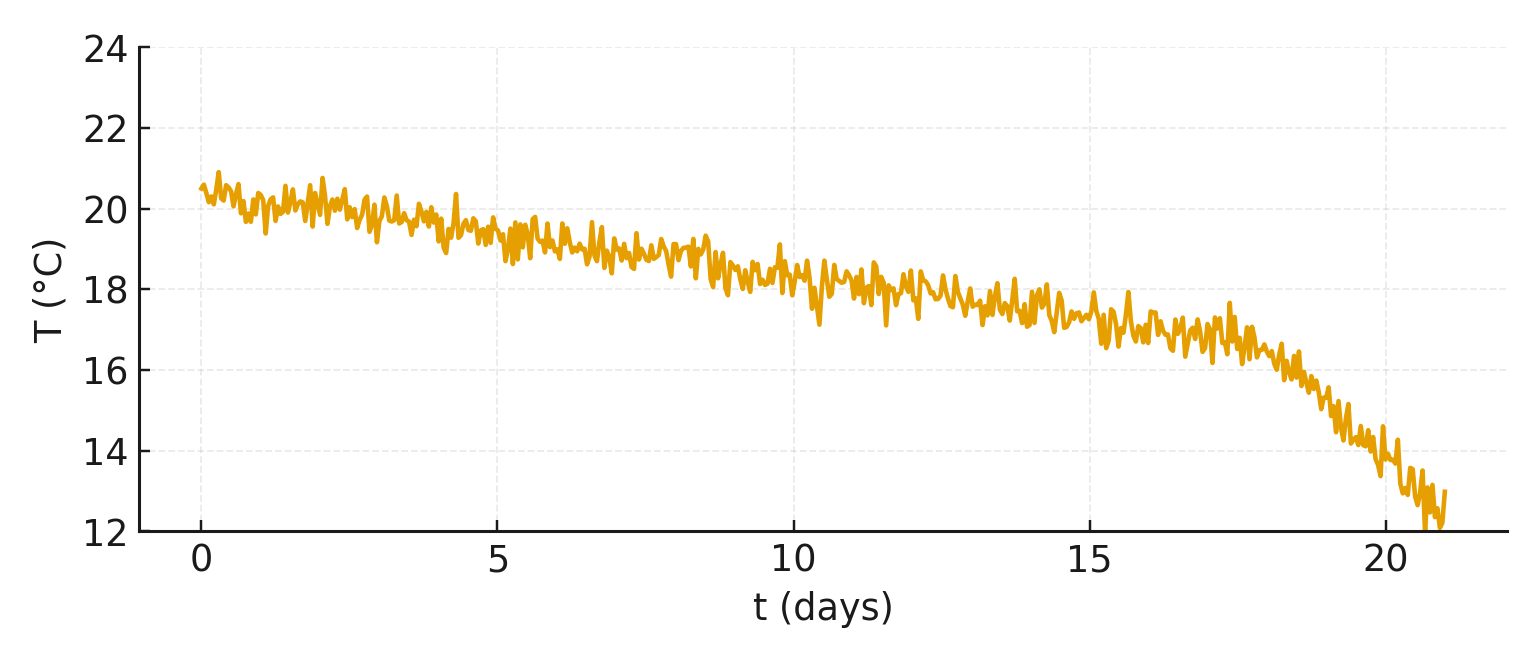 Example 4: Weakening in winter
A slow, sustained downward trend and loss of stable cluster temperature. The colony is weakening or has already died. Check the hive at the next opportunity.
Frequently Asked Questions (FAQ)
How do I read the sensor measurements?
Measurements are read out using an Android app. When you visit the apiary the app connects to the sensors via Bluetooth and displays the temperature curves of all colonies at that site in a clear layout.
Can I save the data for later analysis?
Yes. From the Android app you can send the measurement data to the server with a single tap. There it is available for long‑term comparisons, trend analysis and documentation.
Do I absolutely need a smartphone?
For the first generation of the system readings are performed via an Android app. From spring 2026 you can also use a gateway with a SIM card that will automatically read and upload the data — no manual app interaction on site required.
Do I need an internet connection at the apiary?
No internet connection is required at the site to read data with the Android app — the sensor connection runs over Bluetooth. An internet connection is only needed if you want to upload the data to the server. The SIM‑equipped gateway (from spring 2026) will handle data transmission automatically.
What temperatures are normal in the brood nest?
During active brood rearing the temperature usually ranges between 33 and 35.5 °C. In winter or broodless phases lower and somewhat more variable values are normal.
How does the sensor help with overwintering?
You can see whether the cluster is active, whether a colony is slowly weakening, or if there are sudden collapses. This lets you react in time, for example by planning feed checks or uniting weak colonies.
Can I monitor multiple colonies at once?
Yes. Each sensor belongs to a specific colony. In the app you can manage multiple sensors and compare the temperature curves of all colonies at an apiary. The sensors’ affordable price makes it possible to equip all colonies at a site and keep the whole apiary under observation.